Important Points from Bihar Economic Survey 2020-2021
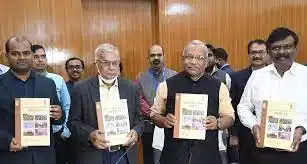
This is the 15th Economic survey of Bihar. The survey has 13 chapters with every chapter having a section on initiatives taken by the government during the pandemic.
Chapter 1 : Bihar Economy : An Overview
- According to the new series of data on Gross State Domestic Product (GSDP), the growth rate of Bihar’s economy in 2019-20 was 10.5% (at constant prices) which is higher than the growth rate for the Indian economy.
- The Gross State Domestic Product (GSDP) of Bihar at current prices was Rs 6,11,804 crore and Rs 4,14,977 crore at the constant (2011-12) prices in 2019-20.
- The NSDP for the state in 2019-20 was Rs. 5,62,710 crore at current prices and Rs. 3,77,216 crore at constant prices.
- The resulting per capita GSDP of Bihar was Rs. 50,735 at current prices and Rs. 34,413 at constant (2011-12) prices.
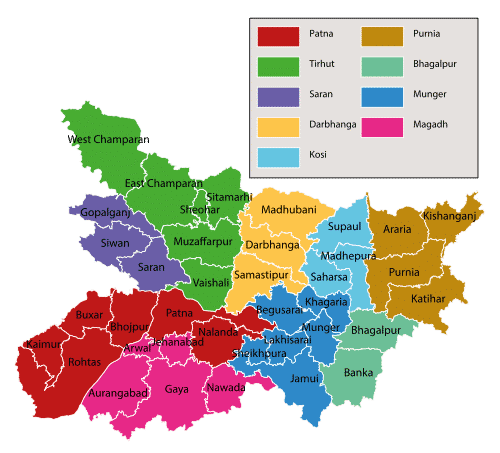
- From the ranking of the 38 districts with regard to Per Capita GSDP in 2017-18, it emerges that the three most prosperous district in Bihar are Patna(Rs. 1,12,604), Begusarai(Rs. 45,540) and Munger (Rs. 37,385). at the other end, the three most impoverished district are : Kishanganj (Rs. 19,313), Araria (Rs. 18,981) and Sheohar (Rs. 17,569).
The share of three major sectors in GSDP :
| Sector | 2019-20 | 2013-14 |
| Primary | 19.5% | 23.4% |
| Secondary | 20.3% | 19.3% |
| Tertiary | 60.2% | 57.3% |
- Within the secondary sectors, two sub-sectors which recorded high growth rates were – EGWUS (Electricity, Gas, Water supply and Other Utility Services) and Construction.
- Within the tertiary sector, there are three sub-sectors that had recorded double digit growth rate in both 2018-19 and 2019-20 – Road transport, Services related to Transport and Public Administration.
Chapter 2 : State Finance
Fiscal indicators for the year 2019-20 are given below:
| Fiscal indicator | Year 2019-20 | Year 2018-19 |
| Total Receipt | Rs 1,53,408 crore | Rs 1,52,287 crore |
| Revenue Receipt | Rs 1,24,233 crore | Rs 1,31,793 crore |
| Capital Receipt | Rs 29,175 crore | Rs 20,494 crore |
| Total Revenue Expenditure | Rs 1,23,533 crore | Rs 1,43,613 crore |
| Capital Expenditure | Rs 20,080 crore | – |
| Revenue Surplus | Rs 699 crore | Rs 6897 crore |
| Total Revenue Expenditure as a percentage of GSDP | 20.2% | 24.2% |
| Borrowing as a share of GSDP | 4.8% | 3.6% |
| Gross Fiscal Deficit of the GSDP | 2% | 2.7% |
| Own tax and non-tax revenue of State | Rs 33,858 crore | Rs 33,539 crore |
| Share of the state’s own revenue as a percentage of total revenue | 27.3% | 25.4% |
- Bihar has been a revenue surplus state since 2004-05. The surplus in 2019-20 declined to Rs 699 crore from 6897 crore in 2018-19. In the financial year 2019-20, there was more reduction in revenue receipt than revenue expenditure, resulting in less revenue surplus.
- The total outstanding debt of the state government in Bihar stood at Rs 1,90,899 crore in 2019-20 and 77.6% of the outstanding liability was public debt. The remaining part of the outstanding liability comprises small savings, Provident fund, Reserve Funds, and Deposits and Advances.
- The total outstanding liability of the State Government in Bihar was 30.9% of the GSDP and public debt was 24.0% of the GSDP in 2019-20.
Chapter 3 : Agriculture and Allied Sectors
- In 2019-20, the overall contribution of agricultural and allied sector to state’s GSDP stood at 18.7%.
- Bihar registered a substantial record in the production of foodgrains at 163.80 lakh tonnes in 2019-20.
- The total consumption of fertilizers in Bihar in 2019-20 was 36.24 lakh tonnes.
Chapter 4 : Enterprises Sector
- The construction sub-sector has been the major driver of growth over the years in Bihar, followed by EGWUS (Electricity, Gas, Water supply and Other Utility Services). Moreover, the contribution of the industrial sector has remained unchanged at 20%, compared to the all-India average of about 31%.
- Between 2007-08 and 2017-18, the growth rate of operating agro-based factories has been as high as 11.7%, which was 9.3 percentage points higher than at the all India level. The growth of the number of agro-based factories suggests that a large portion of agricultural production of Bihar is now actually processed in the state.
Chapter 5 : Labour, Employment and Migration
- The Worker Population Ratio (WPR) for both male and female was the lowest in Bihar, among the major states in India. The female WPRs were 4.0% in rural Bihar and 5.7% in urban Bihar.
- The distribution of workers on the basis of employment status shows that 57.6 percent of male workers in Bihar were self-employed, while the proportion of regular wage/salaried male workers in Bihar was just 9.7 percent, which is the lowest among all states in India.
Chapter 6 : Infrastructure and Communication
- There are altogether 58 national highways in Bihar, whose total length was 5475 km in September 2020.
- From the year 2014 to September 2020, Railways built 300 km of new lines in Bihar.
- The rural tele-density is increasing in Bihar, while urban tele-density is in decline. However, urban telephone density is exceeded per connection per head.
Chapter 7 : Energy Sector
| Energy consumption facts | 2019-20 | 2012-13 |
| Per capita energy consumption | 332 kwh | 145 kwh |
| Projected peak demand | 5900 MW | 2650 MW |
| Peak demand | 5891 MW | 1802 MW |
- The available power capacity in the state was 4767 MW in the year 2018-19, which increased to 6073 MW in 2019-20, implying a growth of 27.4%.
- In order to meet the increased demand of power, an additional capacity of 4516 MW is planned to be added from various sources by 2022-23.
- The Ministry of New and Marine Energy has allocated 5 MW of rooftop solar capacity to Bihar for 2019-20.
Chapter 8 : Rural Development
- Bihar Livelihood Mission (Jeevika) has been continuously working for rural development in the state. The number of Self Help Groups formed so far is 10.17 lakh.
- Lohia Swachh Bihar Abhiyan is an important scheme to improve sanitation in rural areas. So far 96% villages have become open defecation free under this.
Chapter 9 : Urban Development
- In Bihar, the rate of urbanization has been low (11.3 %) compared to the all -India level.
- But recently, 109 new Notified Area Councils have been established, along with 8 new Municipal Councils.
- Apart from this, some areas are also being upgraded which will increase the urbanization rate from 11.3% to 15.2%.
Chapter 10 : Banking and Allied Sectors
- A total of 177 new branches of major banks were opened in the state in 2019-20, out of which 110 were of private banks. Out of these 177 branches, 40.1% are open in rural areas.
- The Credit-Deposit (CD) ratio in Bihar is quite low, the survey said, adding that the CD ratio of scheduled commercial banks in Bihar has increased from 34 per cent in 2018-19 to 36.1 in 2019-20. However, it is lower than the national average of 76.5 per cent.
- None of the districts in Bihar has a CD ratio higher than the all-India average.
- Purnia has the highest Credit Deposit Ratio of 75.1% and Munger has the lowest of 25.9%.
Chapter 11 : Human Development
- In the last 6 years (2014-15 to 2019-20), the per capita development expenditure in the state has been growing at the rate of 17.9% as against the national average of 11.6%. The growth rate of expenditure on education during this period was 17.3% while the growth rate of expenditure on health was 21.4%.
- The total fertility rate in Bihar was 4.4 per woman in 2001, which came down to 3.3 in 2016.
Chapter 12 : Child Development
- In Bihar, 48% of the population belongs to children in the age group of 0 to 18 years.
- The process of budgeting for children in Bihar started in 2013-14.
Chapter 13 : Environment, Climate Change and Disaster Management
- In the year 2019-20, Bihar received an annual rainfall of1094 mms.
- With an aim to revive the culture of bird conservation, Bihar’s first state bird festival, ‘Kalrav’ was held from January 15-17, 2021 at Nagi and Nakti Bird Sanctuaries in Jamui.
Also refer :

