CHAPTER-I : BIHAR ECONOMY : AN OVERVIEW
- The growth rate of Bihar’s economy in 2018-19 was 10.53 percent (at constant prices) and 15.01 percent (at current prices).
- The GSDP of Bihar in 2018-19 was Rs 5,57,490 crore at current prices and Rs 3,94,350crore at constant (2011-12).
- The NSDP for the state in 2018-19 was Rs 5,13,881 crore at current prices and Rs 3,59,030 crore at constant prices.
- The resulting Per Capita GSDP of Bihar was Rs 47,541 at current prices and Rs. 33,629 at constant prices.
Per capita NSDP
- The per capita income for Bihar has increased from Rs. 21,750 in 2011-12 to Rs 30,617 in 2018-19.
- However, Bihar has the lowest per capita income among the states in India and it was at only 33.1 percent of the national average (Rs. 92,565) in 2018-19.
- Thus, the state needs extra push to increase its economic activity so that it converges towards the national average of per capita income.
Sectoral Growth Rate
- Tertiary sector grew at 13.10 and 13.30 percent in 2017-18 and 2018-19 respectively.
- Among the sub-sectors, air transport is seen to have grown at a rate of 36 percent in 2018-19.
- The secondary sector had modest growth rates of 4.73 and 6.29 percent in those two years.
- It was the growth in the primary sector which lost its momentum in 2018-19 and the growth rate came down to 0.63 percent from 6.4 percent.
- The estimated growth in the agriculture came down to -3.87 percent in 2018-19 from 4.88 percent in 2017-18.
- In the secondary sector, manufacturing grew at 3.02 percent and construction at 9.44 percent in 2018-19.
- It can be concluded that the Bihar economy has grown on account of the growth in the tertiary sector. The untapped potential for growth in the primary sector will help the state achieve a higher growth rate in the coming years.
- Following sectors have registered a double-digit growth and has contributed towards growth of the overall economy of Bihar during 2018-19 at constant prices : Air transport (36.0 percent), Other Services (20.0 percent), Trade, Trade & repair services (17.6 percent), Road transport (14.0 percent) and Financial Services (13.8 percent).
- The share of Primary, Secondary and Tertiary sectors in the GSVA was 21.3, 19.7 and 59.0 percent, respectively for 2017-18. For 2018-19 these share are 19.7, 19.1, 61.2 percent respectively.
- The share of Primary sector has come down from 25.8 percent to 19.7 percent during 2011-12 to 2018-19, whereas the share of Tertiary sector has increased from 55.5 percent to 61.2 percent during the same period. The share of Secondary sector was 18.8 percent in 2011-12 and marginally higher at 19.1 percent in 2018-19.
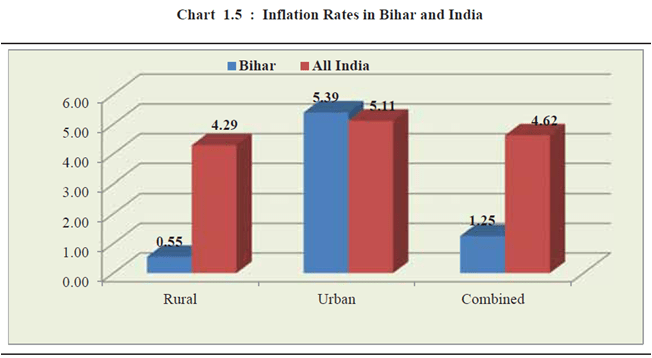
CPI inflation rate for Oct2018-Oct2019
CHAPTER-II : STATE FINANCES
For 2018-19 :
- The fiscal deficit was 2.68 percent of GSDP
- Revenue surplus 1.34 percent of GSDP
- outstanding public debt liability of the State Government was 32.34 percent of GSDP
- Net interest payment was 6.61 percent of the total receipt in revenue account, which has remained within the 10 percent limit, as recommended by the 14th Finance Commission.
The 15th Finance Commission has submitted its report for the year 2020-21. As per its recommendation, the share of Bihar in the total shareable resource pool of the centre has increased from 9.67 percent to 10.06 percent for the year 2020-21.
The total revenue receipt & revenue expenditure increases while capital expenditure decreases in 2018-19 over the previous year.
The receipt from the tax revenues increased by Rs 14,791 crore in 2018-19 to reach Rs 1,03,011 crore, which is 16.8 percent higher than the previous year and the non-tax revenue was Rs 4,131 crore during 2018-19, after an increase of 17.8 percent over the previous year. The receipts under Grants-in-Aid and contributions from the Central Government declined to Rs 24,652 crore in 2018-19.
That is the receipt from the tax revenue and non tax revenue increases over the previous year while the receipt under Grants-in-Aid and contributions from the central government declined in 2018-19.
The SGST and IGST revenue collected by the state was Rs 17,861 crore in 2018-19. The revenue from IGST was about 58 percent of the total revenue collected from GST for the state.
The outstanding liability of the State Government was Rs 1,68,921 crore at the end of 2018- 19, which is 7.7 percent higher than the outstanding liability for the previous year. The public debt accounted for 74.7 percent of the total outstanding liability of the state, and the remaining 25.3 percent of the outstanding liability comprises Small Savings, Provident Fund, Reserve Funds, and Deposits and Advances.
The total borrowing by the State Government in 2018-19 was Rs 18,668 crore, compared to Rs 13,169 crore in 2017-18.
CHAPTER-III : AGRICULTURE AND ALLIED SECTORS
- The contribution of agricultural and allied sectors to the Bihar’s GSVA was 21 percent in 2017-18 and the share of crop sector in the GSVA was 12.1 percent.
- Total expenditure on agriculture and allied sectors in the state increased from Rs. 3615 crore in 2014-15 to Rs. 5176 crore in 2018-19.
- The gross cropped area in Bihar was 75.25 lakh hectares and the cropping intensity was 144 percent in 2017-18.
- The production of cereals increased from 143.21 lakh tonnes in 2017-18 to 158.58 lakh tonnes in 2018-19. Within cereals, rice and wheat together contributed more than 70 percent of the total gross cropped area.
- The Government of India has conferred the Krishi Karman Award to the state on 2nd January 2020, for its achievements in production and productivity of Maize and Wheat.
- Livestock and aquaculture together contributed about 7.1 percent of GSVA in the agriculture sector in Bihar during 2018-19.
- The fish farmers have started exporting fish to the tune of 30,000 MT to the neighbouring states and Nepal.
- Egg production has increased from 111.17 crore in 2016-17 to 176.34 crore in 2018-19. The tentative figure for 2019-20 is 265 crore eggs. With this, the per capita egg production in the state has increased from 11 in 2016-17 to 25 in 2019-20.
CHAPTER-IV : ENTERPRISES SECTOR
- In 2017-18 and 2018-19, a sum of Rs. 742.54 crore has been invested in food processing industries, the highest among all the industries classified under ‘High Priority Sector.’
- In Bihar, 11 sugar mills are presently operating spread across six districts. Between 2017-18 and 2018-19, sugar production has increased by 17.4 percent in the state.
- In 2018-19, COMFED has inducted more societies in Supaul Milk Union in Bihar and Bokaro Dairy in Jharkhand.
- The number of organised societies under the COMFED increased by 9.4 percent, from 20,997 in 2017-18 to 22,971 in 2018-19.
- The daily milk collection across all dairies registered a growth of 18.7 percent during the year.
CHAPTER-V : LABOUR, EMPLOYMENT AND MIGRATION
The worker population ratio (WPR) for male workers in rural Bihar was 64.0 percent, about 8 percent lower than the all-India average. The WPR for female workers was abysmally low at 3.9 percent in rural Bihar. In Bihar, 55.9 percent males were self-employed in 2017-18.
Major employment-generating industries for working males in Bihar were — agriculture, forestry and fishing (44.6 percent), construction (17.1 percent), wholesale and retail trade, repair of vehicles (12.3 percent), and manufacturing (9.3 percent). For female workers, major employment-generating industries were — agriculture, forestry and fishing (53.6 percent),and education (25.7 percent).
In Bihar, 75 percent of total migration took place due to marriage, compared to 46 percent at the all-India level in 2011. Only 2.9 percent of total migration took place due to work/employment and business. Of the total number of people migrating due to work, employment and business, 76 percent were men.
The number of passports issued from the Regional Passport Office in Patna is more than 3 lakhs per year during 2015-16 to 2018-19.
The Bihar State Migrant Labour Accidental Grant Scheme, 2008 was implemented in all districts of Bihar. The quantum of compensation are — Rs. 1.00 lakh for death, Rs. 75.00 thousand for permanent absolute disability, and Rs. 37.50 thousand for permanent partial disability.
CHAPTER-VI : INFRASTRUCTURE
- The growth in the transport sector was 11.0 percent during the period 2011-12 to 2018-19.
- Implementation of road safety measures has ensured that the number of road accidents per lakh population is the lowest in Bihar (9.3) among all major Indian states during 2018.
- Bihar ranked 7 in terms of SH road density per 1000 sq. kms, with 45.2 kms of SH per 1000 sq. km of area.
- In term of SH length per lakh population, Bihar holds 15th position among the major states of India, with 3.7 kms of road for one lakh population.
- Bihar has 4917 kms length of NH and more than 80 percent of these roads are two or more lane roads.
- Bihar was at the third position among major states of India in 2017 in terms of rail route per thousand sq.km. of area.
- A total of 9084 post offices were in Bihar as of March, 2018. Out of this, 8625 (94.9 percent) were in rural areas and 459 (5.1 percent) in urban areas.
CHAPTER-VII : ENERGY SECTOR
There has been a significant increase in the projected peak demand for electricity in Bihar from 2650 MW in 2012-13 to 5300 MW in 2018-19, implying a growth of around 100 percent in six years.
The peak deficit has substantially decreased to only 3 percent in 2018-19. The per capita consumption of the electricity in the state has risen from 145 kwh in 2012-13 to 311 kwh in 2018-19, implying a growth of 114 percent in six years.
The expected power demand of Bihar by 2021-22 shall be of the order of 6900 MW, with an annual energy requirement of 39,841 MU.
To prioritise the renewable energy sources, the State Government has created an institution called Bihar Renewable Energy Development Agency (BREDA), which is primarily engaged in the execution of various projects on solar pumps and solar installations.
CHAPTER-VIII : RURAL DEVELOPMENT
About 84,88,964 SHGs were formed by JEEViKA. The project has been able to leverage bank credit worth Rs 8169 crore till 2018-19.
The State Government has launched a new scheme, ‘Satat Jivikoparjan Yojana’ (SJY), in August 2018. JEEViKA has been designated as the nodal agency for implementation of SJY, with a budgetary outlay of Rs 840 crore for three years. The objective of this scheme is to provide sustainable income-generating assets to extremely poor households, including those who were traditionally involved in production and sale of country liquor or toddy before the imposition of liquor prohibition in April 2016.
Under the Abhiyan Basera, 1,11,080 households identified belonging to different categories and, till 2017-18, 66,396 households were provided with required homestead land.
Under MNREGA, between 2017-18 and 2018-19, the number of job cards issued increased from 148 lakh to 155 lakh.
CHAPTER-IX : URBAN DEVELOPMENT
The number of Self-Help Groups (SHGs) formed under NULM has increased from 2185 in 2017-18 to 5640 in 2018-19.
Recently, Patna Metro Rail Project, with a total cost of Rs 13,366 crore, has been sanctioned. In this regard, the State Government has already constituted Patna Metro Rail Corporation Ltd. (PMRCL) to construct 31.39 kms of the metro to cover East-West and North-South corridors.
CHAPTER-X : BANKING AND ALLIED SECTORS
- The banking infrastructure has increased in the semi-urban areas in Bihar at a higher pace than in the rural and urban areas in Bihar.
- The Scheduled Commercial Banks (SCB) have the largest presence in the state among all types of banking institutions.
- With a share of 4.9 percent in 2019, Bihar is at the 10th position in terms of share of branches of the commercial banks.
- During 2018-19, 2.19 lakh KCCs were issued in the state by different financial institutions.
- The NPA of all banks in Bihar as on March 2019 was 10.9 percent.
- Among the banks in Bihar, the NPA for the RRBs is the highest at 25.2 percent in March 2019.
- The highest percentage of NPA was in the agriculture sector at 19.1 percent in March 2019.
- During 2018-19, loan amounting Rs. 7458.00 crore was sanctioned in Bihar under the PMMY scheme.
- The share of Kishore Loans was 47 percent, followed by Shishu and Tarun Loans with the shares of 30 and 23 percent, respectively.
CHAPTER-XI : HUMAN DEVELOPMENT
- Between 2011-12 and 2018-19, the level of Per Capita Development Expenditure (PCDE) in Bihar has grown at 14.2 percent, compared to the national average of 13.3 percent.
- The expenditure on education in the state increased at an annual rate of 13.8 percent, which is higher than that of the all-India average of 12.8 percent.
- The expenditure on health also registered an annual growth rate of 20.8 percent, and was higher than that of the all-India average.
- The life expectancy at birth in Bihar in 2013-17 was 69.2 and 68.6 years for males and females, respectively.
- There was an increase of 14.8 percentage points in the literacy rate of Bihar which has improved significantly from 47.0 percent in 2001 to 61.8 percent in 2011.
- Bihar has 879 colleges and 33 universities, of which 28 are traditional universities, four are private universities and one of them is an open university. There are also 15 research institutes in the state. The state has 34 engineering colleges and 54 polytechnic institutes.
CHAPTER-XII : CHILD DEVELOPMENT
In India, 39 percent of the population belongs to the age group of 0-18 years, as per Census 2011; whereas, in Bihar, 48 percent of the population is in that age group. Bihar accounts for 11 percent of India’s total child population.
The Census 2011 data reveals that the child sex ratio was higher than the overall sex ratio in Bihar. The child sex ratio was 935 females per 1000 males, 923 in 0-14 years age-group, and 897 in the age group of 0-18 years. The child sex ratios among the Scheduled Castes (962) and Scheduled Tribes (969) are better than the state average of 935.
The practice of Child Budgeting started in Bihar in 2013-14, presenting the details of all schemes related to child welfare.
As per 2011 census, the literacy rate in Bihar stood at 61.8 percent. However, female literacy rate has been much lower at 51.5 percent compared to the male literacy rate (71.2 percent) in Bihar.
The decrease in the number of total out-of-school children from 2.17 lakh in 2016- 17 to 1.44 lakh in 2018-19 is the result of the focused approach of the State Government.
There are 33 Child Homes functioning in different districts of the state to support and rehabilitate destitute, abandoned and orphaned children.
CHAPTER-XIII : ENVIRONMENT AND CLIMATE CHANGE
During 2018-19, Bihar recorded an annual rainfall of 780 mms.
Kishanganj received the highest annual rainfall of 1522 mms., while the lowest rainfall was observed in the district of Jehanabad (403 mms.).
Bihar has about 285 wetlands, with a total area of 3992 hectares, accounting for nearly 0.6 percent of the total recorded forest area of the state in 2019.
The total forest and tree cover together in Bihar constituted about 9309 sq. kms. in 2019, which is about 9.9 percent of the total geographical area of the state.
Jal-Jeevan-Hariyali is a flagship programme of the State Government which is intended to tackle issues relating to climate change and environmental degradation.
The total expenditure for the execution of various schemes under Jal-Jeevan Hariyali Campaign is estimated to be Rs 24,524 crore during 2019-20 to 2021-22.
The Valmiki Tiger Reserve is located in an area of 893.73 sq. kms. in the district of West Champaran, housing the Panthera Tigris.
As per the estimates of the National Tiger Conservation Authority, the tiger population in Bihar increased from 8 in 2010 to 31 in 2018.
The Vikramshila Gangeya Dolphin Sanctuary, situated in Bhagalpur, provides habitat for the Gangetic Dolphin (Platanista Gangetica), freshwater fishes and turtles.
CHAPTER-XIV : E–GOVERNANCE
An IT city in Rajgir (Nalanda), one IT tower and one IT park in Patna, Software Technology Park of India (STPI) in Darbhanga, Bhagalpur and Patna, Centre of National Institute of Electronic and Information Technology (NIELIT) in Bihta, Buxar and Muzaffarpur and Incubation Centre at IIT, Patna (Bihta) for Medical Electronics have either been completed or are in progress.
Public Finance Management includes the cycle of budget formulation, budget execution, accounting, reporting, external scrutiny and audit; therefore, the State Government has implemented CFMS in 2019.
Also refer :